

GET TO KNOW MAPBIOMAS ALERTA METHOD
MapBiomas Alerta is a monitoring system that integrates deforestation and natural vegetation loss alerts in Colombia from multiple national and global detection sources. These alerts undergo aggregation, validation—based on the comparison of high- and medium-resolution satellite imagery (PlanetScope, with a spatial resolution of 3.7 meters, and Sentinel, with a spatial resolution of 10 meters)—refinement, auditing, and publication on an event-by-event basis. As a result, a detailed individual report is generated for each alert, including before-and-after imagery of the event, the precise delineation of the affected area, the date of occurrence, the likely cause, and its intersection with territorial geographic information. All of this information is consolidated and made available through a single open-access platform:
https://plataforma.colombia.alerta.mapbiomas.org/
The MapBiomas Alerta processing methodology is described below:
DESCRIPTION OF THE STEPS
El proceso de MapBiomas Alerta comprende seis etapas: compilación, validación, refinamiento, cruce con datos públicos, auditoría y publicación de las alertas con sus respectivos informes detallados (Figura 1).
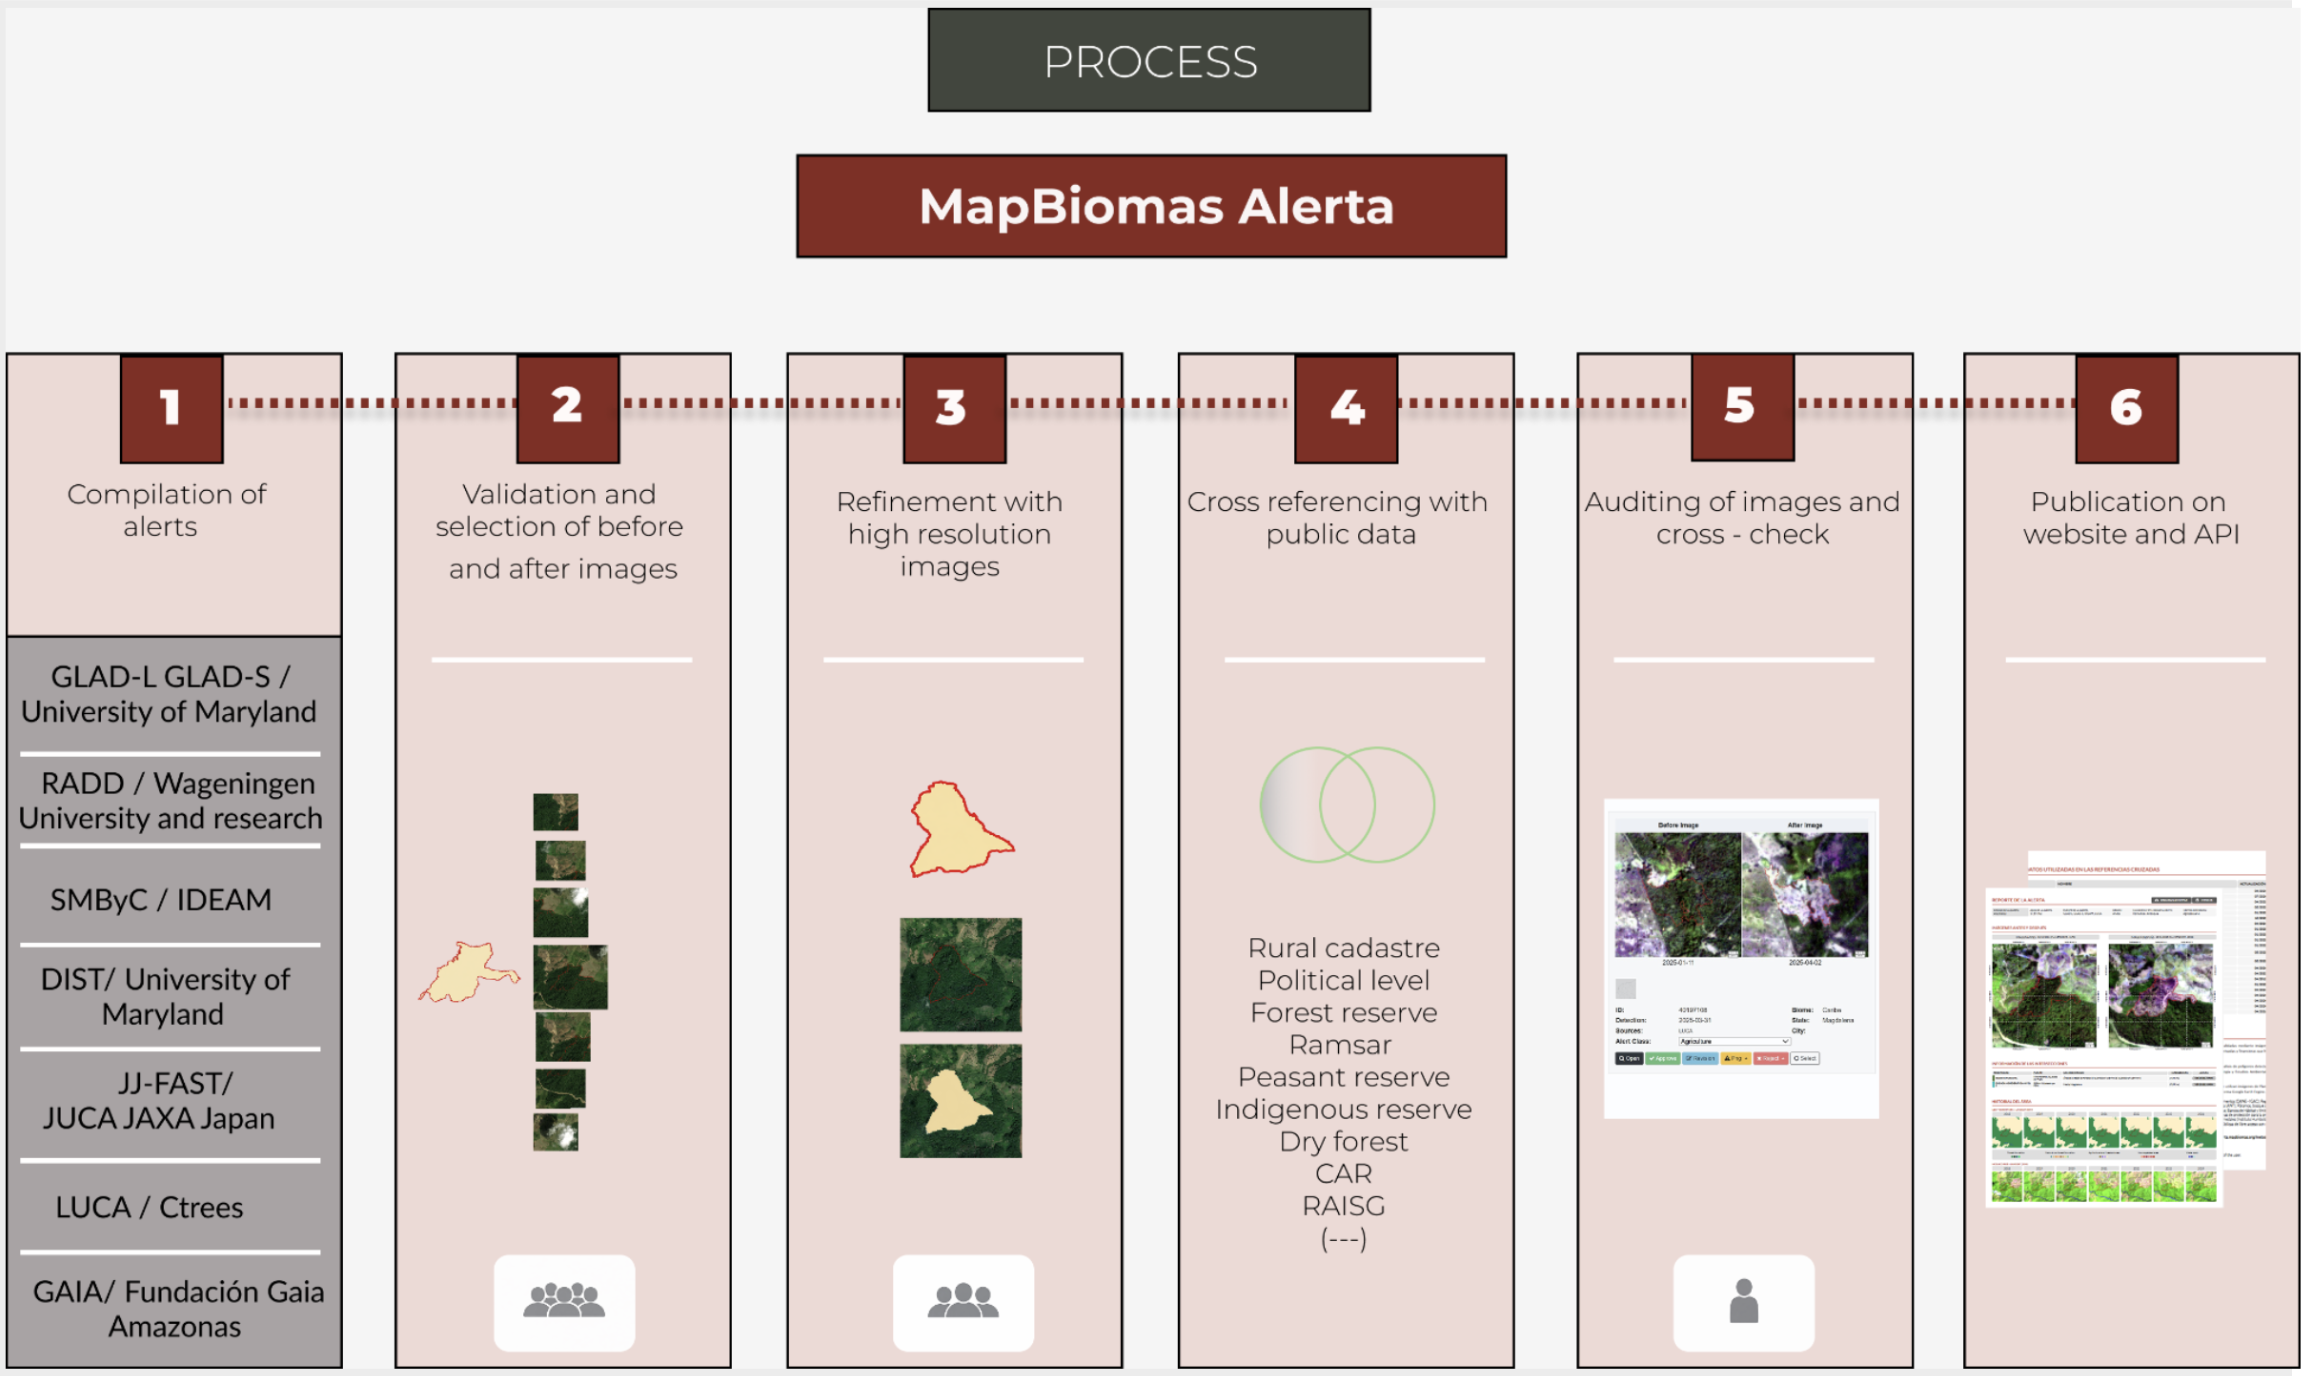
Figure 1. Graphical overview of the MapBiomas Alerta methodological workflow.
Step 1: Compilation of Existing Alerts for All Regions of Colombia
MapBiomas Alerta collects, organizes, and consolidates information generated by various official and independent national and global monitoring systems that produce deforestation and natural vegetation loss alerts based on satellite imagery with spatial resolutions ranging from 10 to 30 meters (Table 1). For 2025, MapBiomas Alerta compiled the monthly alerts provided by the following existing sources and information systems:
Table 1. Deforestation and Natural Vegetation Loss Detection Systems Used by MapBiomas Alerta.
| Monitoring system | Definition | Institution Responsible | Operational Period (Colombia) | Satellite system | Update | Coverage |
| GLAD-L / GLAD-S2 | Global Land Analysis & Discover | University of Maryland | 2015 – present | Landsat (30m) Sentinel-2 (10m) | Every 8 and 5 days | Tropical forests |
| RADD | Radar Alerts for Deforestation Detection | Wageningen University & Research and Satelligence | 2019 – present | Sentinel-1 (10m) | Every 6–12 days | Tropical forests |
| SMByC | Sistema de Monitoreo de Bosques y Carbono | IDEAM | 2012 – present | Landsat (30m) | Quarterly | Colombia |
| JJ-FAST | Warning System in the Tropics | JICA/JAXA Japan | 2017 – 2024 | ALOS-2 (3-10m) | 1.5 months | Tropical forests |
| LUCA | Land Use Change Alerts | CTrees | 2018 – present | Sentinel-1 (10m) | Every two weeks | Global |
| DIST | Land Surface Disturbance Alert | NASA - University of Maryland | 2023 – present | Harmonized Landsat and Sentinel-2 (HLS) | Every two weeks | Global vegetated areas |
| GAIA | N/A | Fundación Gaia Amazonas | 2024 – 2025 | Sentinel-1 (10m) | Monthly | Colombian Amazon and Orinoquía |
Step 2: Validation and Selection of Before-and-After Images
The validation process is carried out in two stages:
1. Semi-automated filtering and screening: The system automatically discards alerts that overlap with others previously validated, refined, and published in earlier analyses, thereby preventing duplication of information. In such cases, the detection system associated with each discarded duplicate alert is incorporated into the list of sources that detected the corresponding event.
2. Visual inspection: Specialized regional analysts (Amazon, Andes, Caribbean, Pacific, and Orinoquía) conduct a comprehensive review using monthly high- and medium-resolution satellite mosaics (3.7-meter and 10-meter spatial resolution).
During this phase, false positives are identified and discarded, with the reason for rejection formally recorded according to the following criteria:
- Duplicity: Alerts corresponding to the same event detected by different monitoring systems.
- Seasonality: Changes in the spectral response of the images due to droughts or floods that do not involve the loss of forest or natural vegetation.
- Disturbance of previously altered areas: Areas that had already been transformed or correspond to secondary vegetation.
- Burned areas: Areas affected by fire where no subsequent land-use change has occurred.
Selection of satellite evidence: Once a deforestation or natural vegetation loss event is confirmed, before-and-after images are selected from the PlanetScope constellation, accessed under an exclusive agreement, or from the Sentinel satellite archive: one representing the "before" condition (forest or natural vegetation) and the other representing the "after" condition (transformed area).
To ensure an appropriate level of detail in the reports, the following technical criteria are applied:
- Territorial context: The selected images cover a minimum area of 700 × 700 meters and a maximum area of 50 × 50 km, adjusted to the size of each individual event. The event is centered within the image to provide a clear view of the affected area and its surrounding context.
- Critical timing: Priority is given to selecting before-and-after images with the shortest possible time interval between them, subject to image availability, in order to accurately document the timing of the vegetation loss.
- Image quality: Images containing cloud cover over the event, haze, banding artifacts, or geometric displacement errors are avoided.
Step 3: Refinement of the Affected Area Using the Random Forest Algorithm
Once the alert has been confirmed as valid and the satellite images have been selected, the affected area is delineated. This process results in a polygon representing the boundaries of the observed deforestation or natural vegetation loss event.
The refinement is carried out through a semi-automated classification procedure that delineates the boundaries of the area where the deforestation or natural vegetation loss event occurred. To accomplish this, artificial intelligence is applied using the supervised Random Forest, executed in Google Earth Engine through a dedicated workspace module (MapBiomas Alerta Workspace) developed by MapBiomas for the processing and refinement of alerts.
This procedure comprises the following stages:
- Sampling of areas without natural vegetation loss: Selection of representative pixel samples from areas where no deforestation or natural vegetation loss has occurred. These samples may include intact forest that remains unchanged between the two images, secondary vegetation, water bodies, existing roads, grasslands, and other land cover or land-use classes present within the analysis area that do not represent deforestation or natural vegetation loss.
- Sampling on transformed surfaces: Selection of representative pixel samples from areas where deforestation or natural vegetation loss is evident.
The final classification results in a refined polygon representing the area of forest or natural vegetation loss. This polygon then undergoes a cleaning, simplification, and smoothing process to remove residual polygons and unnecessary vertices, while smoothing its boundaries (Figure 2). Based on the before-and-after satellite imagery and the local context of the alert, the interpreter also identifies and assigns the pressure vector that most likely caused the event. These pressure vectors are classified into the following categories:
1. Anthropic Vectors
- Livestock: Raising, management, and production of livestock and other domestic animals.
- Agriculture: Agricultural production systems.
- Mixed agriculture and livestock: Integrated agricultural and livestock production systems.
- Mining: Extraction of mineral resources through open-pit mining.
- Road construction: Construction and development of transportation infrastructure, including roads, highways, and access routes.
- Urban expansion: Growth and consolidation of infrastructure associated with human settlements and urban areas.
- Traditional Indigenous land use: Traditional subsistence food production systems (chagras).
- Forest plantation: Establishment of forest production systems through the planting of tree species for commercial purposes, including timber production and the supply of raw materials.
- Aquaculture: Production systems for aquatic organisms through the construction or adaptation of ponds, tanks, or other aquaculture infrastructure.
2. Natural Vectors
- Windthrow: Large-scale tree fall caused by high-intensity wind gusts.
- Flooding: Loss of vegetation cover associated with the overflowing of water bodies.
- Landslides: Mass movement processes that remove vegetation due to slope instability, primarily in mountainous or hilly terrain.
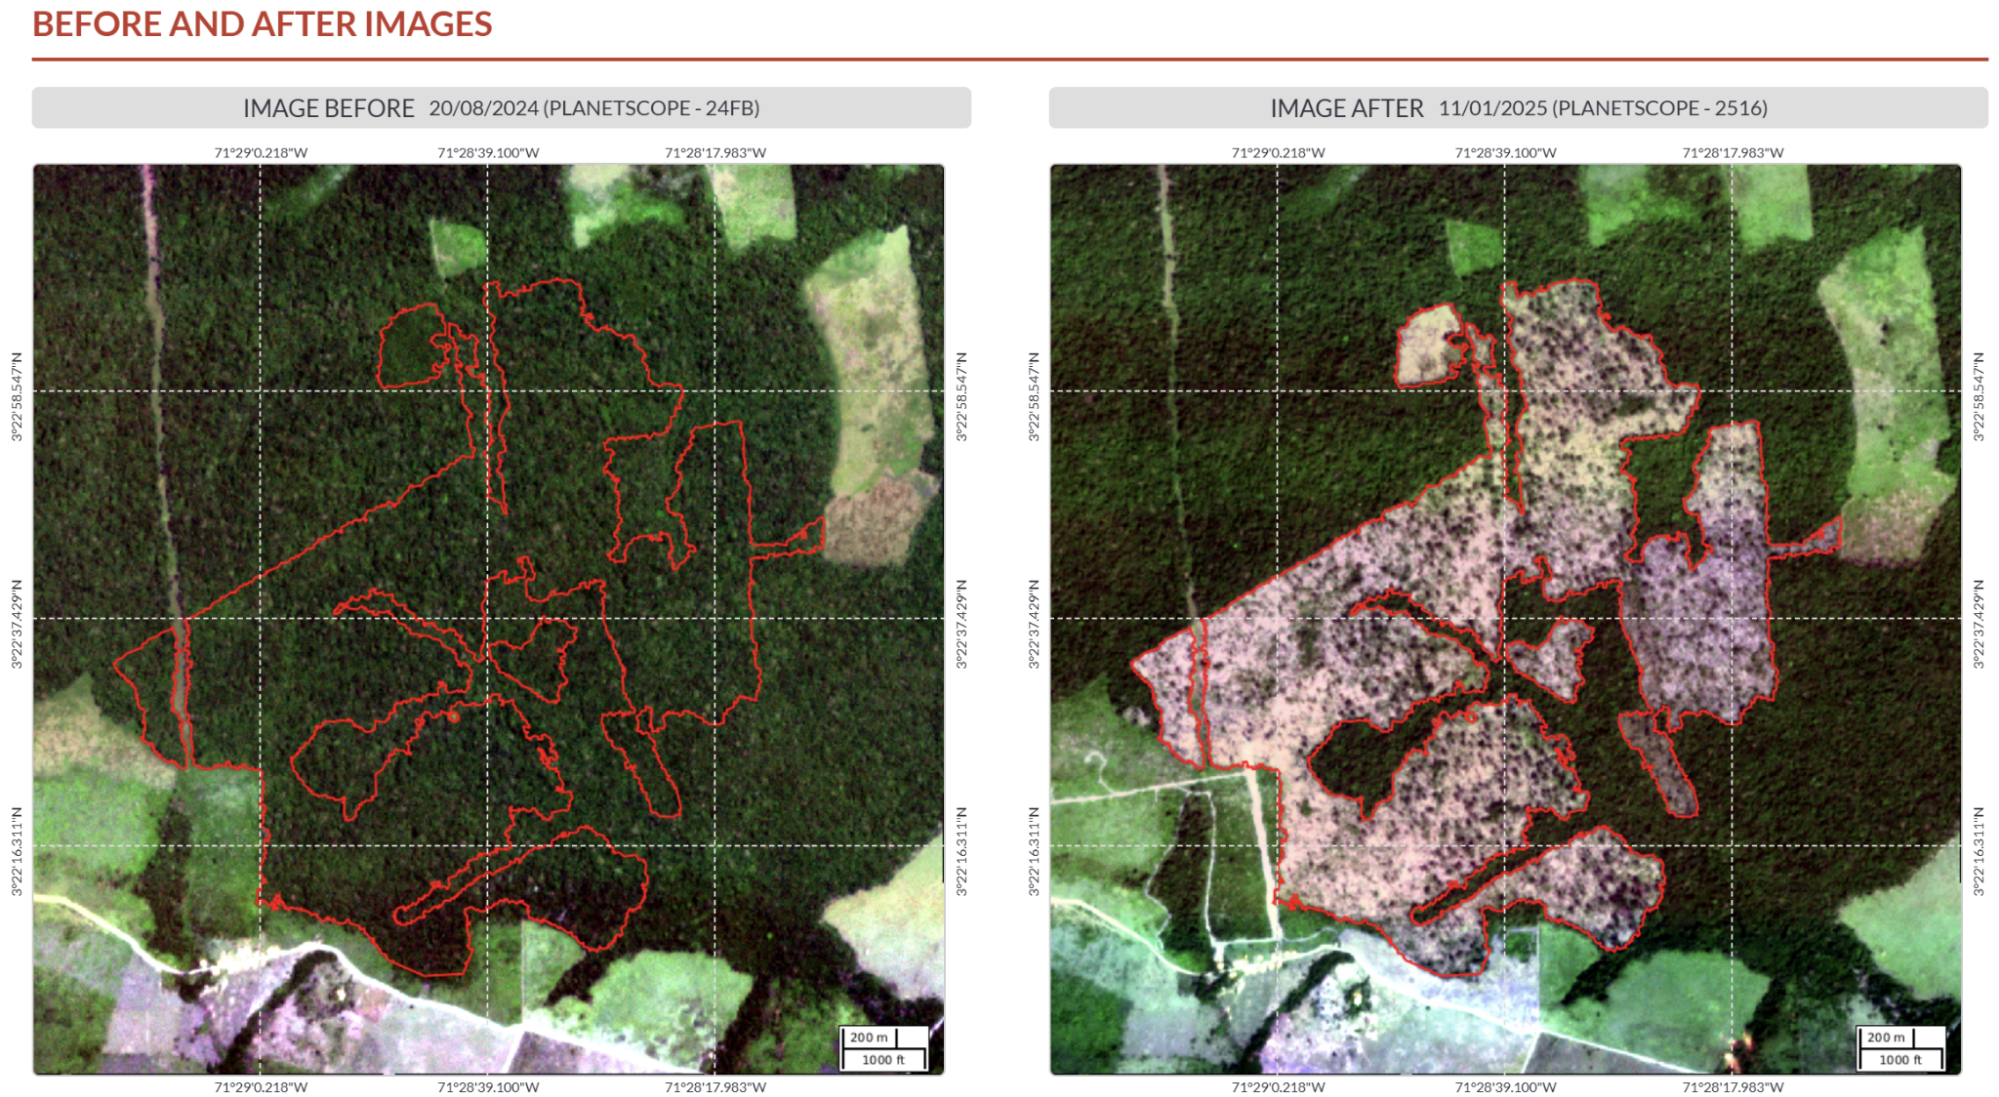
Figure 2. Example of Planet imagery showing before-and-after views of a deforestation event, together with the refined alert polygon (ID 40155449).
Step 4: Cross-Verification with Public Secondary Territorial Databases
The refined polygons are spatially intersected with territorial and contextual datasets obtained from various official institutions (Table 2). The results of these spatial intersections, together with their corresponding overlap areas, are included in the individual reports.
Table 2: Public and Official Geographic Datasets Compiled for Spatial Intersection with Each Event Published by MapBiomas Alerta Colombia.
| Institution | Official layer name | Year |
| Agencia Nacional de Tierras (ANT) | Peasant Reserve Zone | 2025 |
| Community Councils | 2024 | |
| Indigenous Reserves | 2025 | |
| Departamento Administrativo Nacional de Estadística - Instituto Geográfico Agustín Codazzi (DANE–IGAC) | Department | 2022 |
| Municipality or ETI | ||
| Fundación Gaia Amazonas (Gaia Amazonas) | Regions | 2025 |
Instituto de Hidrología, Meteorología y Estudios Ambientales (IDEAM) | Hydrographic Basin Level 2 | 2022 |
| Instituto Geográfico Agustín Codazzi (IGAC) | Cadastre | 2026 |
| Unidad de Planificación Rural Agropecuaria (UPRA) | Agricultural Frontier | 2025 |
| Peasant Agro-food Territories | 2026 | |
| Protection Zones for Food Production | 2025 | |
| Ministerio de Ambiente y Desarrollo Sostenible (MADS) | Tropical Rainforest | 2019 |
| CAR Boundary (Regional Autonomous Corporation) | 2023 | |
| Paramo | 2021 | |
| Forest Reserves (Law 2 of 1959) | 2025 | |
| Forest Development and Biodiversity Hubs | 2025 | |
| Forest Management Plans | 2026 | |
| Environmental Sanctions | 2026 | |
| Peace Forests | 2023 | |
| Habitat Banks | 2024 | |
| RAMSAR | Ramsar Sites | 2024 |
| Parques Nacionales Naturales (PNN) - Registro Nacional de Áreas Protegidas (RUNAP) | National Protected Natural Area | 2023 |
| Departmental Protected Area | ||
| Instituto Amazónico de Investigaciones Científicas SINCHI (SINCHI) | Conservation Agreements | 2026 |
| Instituto de Investigaciones Marinas y Costeras José Benito Vives de Andréis (INVEMAR) | Mangroves | 2023 |
| Autoridad Nacional de Licencias Ambientales (ANLA) | Licensed Projects | 2025 |
| Projects Under Evaluation | 2025 | |
| El Instituto de Investigación de Recursos Biológicos Alexander von Humboldt (IAvH) | Wetlands | 2016 |
| Agencia Nacional de Minería (ANM) | Mining Titles | 2026 |
| Active Mining Applications |
This information enriches, characterizes, and contextualizes each alert, facilitating the generation of technical reports supported by official, up-to-date, and relevant information for a wide range of purposes, including political and administrative decision-making, productive activities, environmental management, social analyses, among others.
Protocol for Updating and Curating Territorial Information Layers
MapBiomas Alerta implements a continuous workflow for the maintenance and updating of its territorial information layers to ensure that the territorial context used for spatial intersection with alerts remains current.
This process includes the continuous integration of new geospatial datasets as they are released by official institutions through public platforms or obtained through direct coordination with the competent authorities when the information is not available in open-access repositories.
MapBiomas Alerta also performs data curation, which may include topological, geometric, or alignment adjustments to ensure consistency with international boundaries. These adjustments are strictly limited to improving system functionality and the quality of data visualization for users, without introducing any substantive changes to the reported information.
Step 5: Technical Audit
The technical audit constitutes the final stage of quality control and scientific assurance before the public release of the data.
During this stage, the regional lead analysts (Amazon, Andes, Caribbean, Pacific, and Orinoquía) conduct a comprehensive review of each event to ensure the consistency and reliability of the entire process.
The audit focuses on three critical verification steps:
- Satellite image quality: The "before" and "after" images are verified to ensure they are free of cloud cover, shadows, or processing errors that could hinder the clear interpretation of the event. The audit also confirms that the event is centered within the images, that the images are not cropped, and that the time interval between them is as short as possible.
- Refinement quality: The refined polygon is evaluated to ensure that it accurately represents the transformed area, confirming that no deforested areas have been omitted and that no unaffected natural vegetation or secondary vegetation has been incorrectly included.
- Consistency of the pressure vector: The assigned pressure vector is assessed to determine whether it appropriately represents the most likely cause of the natural vegetation loss event, based on the territorial context and the visual patterns observed.
Step 6: Publication and Report Generation
The polygons corresponding to validated deforestation and natural vegetation loss alerts that have successfully passed the validation, refinement, and technical audit stages are published weekly on the MapBiomas Alerta web platform. For each confirmed event, the system automatically generates a detailed individual report containing the following information:
- Unique alert identification code.
- Original alert source (detection system).
- Political-administrative location (region, department, and municipality or Indigenous Territorial Entity [ETI]).
- Affected area in hectares (ha).
- Before-event image and acquisition date.
- After-event image and acquisition date.
- Spatial intersection with territories of interest.
- Historical land cover and land use data from MapBiomas Colombia.
- Historical Landsat imagery.
- Data sources used for the territorial intersections.
All reports associated with published alerts are publicly available and can be downloaded free of charge in PDF format. The georeferenced polygon corresponding to each deforestation or natural vegetation loss alert is also available for download in Shapefile (SHP) format.
Post-publication Alert Cancellation and Correction
Under certain circumstances, alerts published on the MapBiomas Alerta platform may be corrected or even canceled. Whenever a formal notification or a well-founded request identifying potential errors associated with an alert is submitted—either by environmental authorities or by platform users—the corresponding cancellation or correction procedure is initiated. In such cases, the technical team conducts a thorough review of the related alerts.
This review is carried out by examining the satellite imagery and other complementary sources of information. When it is confirmed that a published alert does not correspond to a deforestation or natural vegetation loss event, the alert is canceled. This means that it is removed from the platform's map and statistical summaries but retained in the database for individual consultation using its unique identification code.
In some cases, corrections may be made to the spatial delineation of an alert in order to more accurately represent the reported event (Figure 3). Likewise, if an error or issue is identified in the satellite images associated with the alert polygon, new images may be selected and updated on the platform. All corrections are recorded in the system, and the updated information is made publicly available on the platform, including the date on which the alert was corrected.
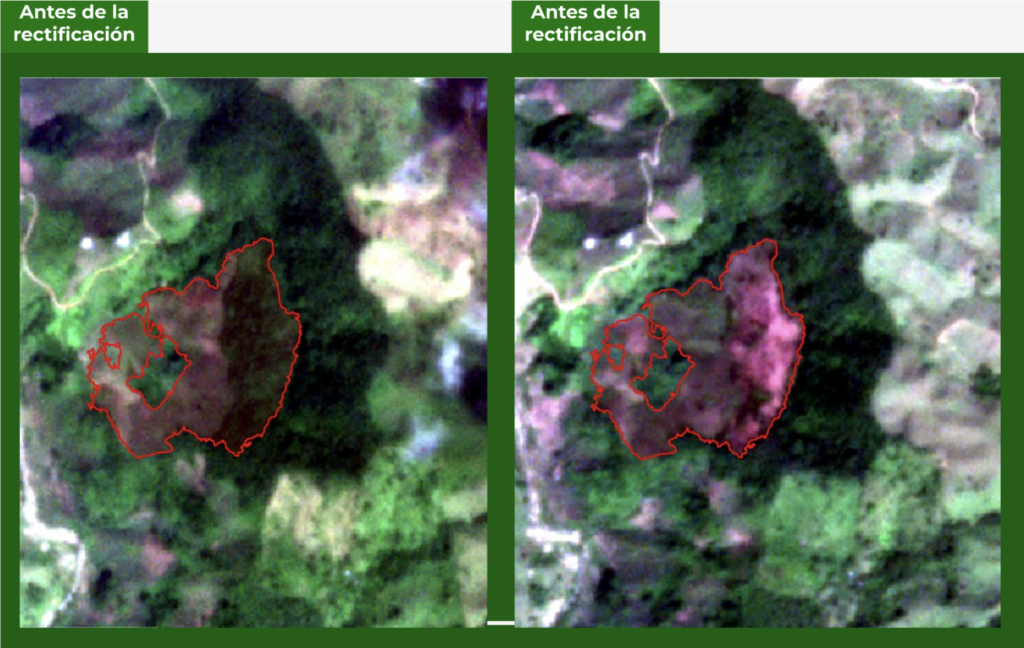
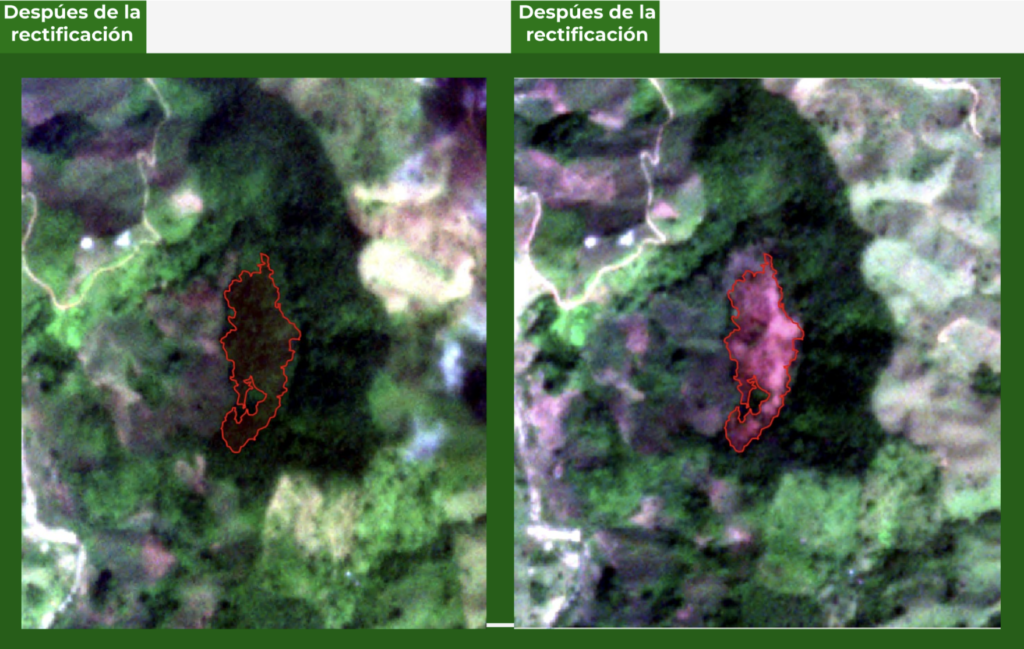
Figure 3. Example of a post-publication correction to the spatial boundaries of Alert ID 40219356, detected in 2025. The alert was corrected because the affected area corresponded to secondary vegetation.
| MapBiomas Alerta does not conduct any assessment or make any determination regarding the legality of the deforestation or natural vegetation loss alerts displayed on the platform. Any detected and confirmed loss of natural vegetation constitutes an alert. The evaluation of its legal status is the sole responsibility of users, public authorities, and private or financial institutions that have free access to the data provided by MapBiomas Alerta Colombia. MapBiomas assumes no responsibility for decisions made by these agencies or institutions based on the published alerts, as they represent impartial and neutral data on the occurrence of deforestation and natural vegetation loss in the country. |
Method Limitations
Like any methodology, MapBiomas Alerta has certain limitations that should be considered when consulting and analyzing its data:
- Processing Time: Alerts are imported from the detection systems on a monthly basis (except for alerts produced by IDEAM, which are published every three months), or whenever each source makes its data available. Since part of the alert processing is carried out individually through visual interpretation by trained analysts, the time required for validation and processing depends on the region and the time of year. Consequently, the time elapsed between the original detection date and the publication of the alert on the MapBiomas Alerta Colombia platform may vary. The objective of MapBiomas Alerta is to maximize the reliability of the reported deforestation and natural vegetation loss events while providing detailed, ready-to-use reports as promptly as possible.
- Alert omissions: Deforestation and natural vegetation loss alerts in MapBiomas Alerta are validated and refined only if they have previously been detected by one of the monitoring systems used in the project. Consequently, omissions by these detection systems are directly reflected in the results presented on the platform.
In Colombia, official monitoring systems such as IDEAM, together with global sources including GLAD, RADD, JJ-FAST, DIST, and LUCA, collectively provide nationwide coverage. GLAD-L uses Landsat imagery (30 m) to automatically identify disturbances in forest cover across tropical regions. Its performance is most reliable in areas with dense forest cover (>60%), such as the Amazon, but it may have limitations in detecting changes in fragmented landscapes or areas with mixed land cover, such as the Caribbean region or the savannas of the Orinoquía. To mitigate this limitation, DIST and LUCA alerts, which are specifically designed to detect land disturbances and land cover changes, were incorporated to complement forest monitoring alerts and improve the identification of natural vegetation loss and transformation events across different environmental contexts in Colombia.
- Underestimation of the Rate of Deforestation or Natural Vegetation Loss: During the validation and refinement process, a pair of satellite images is selected to represent the conditions before and after the event. The "before" image corresponds to the most recent available image of sufficient quality acquired prior to the detected event, while the "after" image is the one acquired closest to the completion of the event. The time interval between the two images is generally up to 12 months (except in exceptional cases due to image availability).
In regions with persistent cloud cover, such as the Colombian Andes and Pacific, the limited availability of cloud-free imagery may increase the time interval between the selected images, extending the temporal gap by several weeks or even months.
Although this does not alter the fact that the deforestation and/or natural vegetation loss occurred between the two acquisition dates, it does affect the estimation of the average rate at which the vegetation loss event occurred.
- Automatic polygon delineation: The polygons defining the refined alerts are generated through an automated classification process that identifies the area of change between the two satellite images, that is, the area where natural vegetation was removed. During the delineation process, areas showing evidence of previous disturbance are excluded from the final polygon.
- Limitations in Detecting Non-Forest Natural Vegetation:: In Colombia, the detection of non-forest natural vegetation loss, such as in savannas and páramos, presents limitations in the alert-generating systems, as these systems are primarily designed to detect forest loss. To mitigate this limitation, the DIST and LUCA detection systems were incorporated, as they focus on identifying land disturbances and land cover changes regardless of whether they occur in forests or in other types of natural vegetation.
Differences from Official Data
MapBiomas Alerta is a system for the validation and refinement of deforestation and natural vegetation loss alerts generated by multiple monitoring sources. Unlike other systems that report consolidated estimates based on specific methodologies, the results produced by MapBiomas Alerta are built progressively through the individual validation, refinement, and technical audit of each alert, analyzed on an event-by-event basis.
The platform is updated continuously, with newly validated events incorporated on a weekly basis as they complete the technical review process. Consequently, the statistics available on the platform represent the progress of the validation process at the time of consultation and change as new events are published each week. The current validation progress can be viewed directly in the Statistics section of the platform.
Comparisons with official figures or with other monitoring systems should only be made once the validation process for the period of interest has reached a sufficient level of completeness, ideally approaching 100% of the alerts identified for that year. It is also important to recognize that differences may arise from the distinct objectives, methodologies, definitions, reporting criteria, scales of analysis, and levels of accuracy associated with each monitoring system. Therefore, the resulting figures and datasets are not always directly comparable.